
visual summaries
Visual summaries turn thought and words into image. Posters, infographics, visual abstracts, scicommics—visual summaries break down complex information and lay out the content clearly and engagingly for your audience.
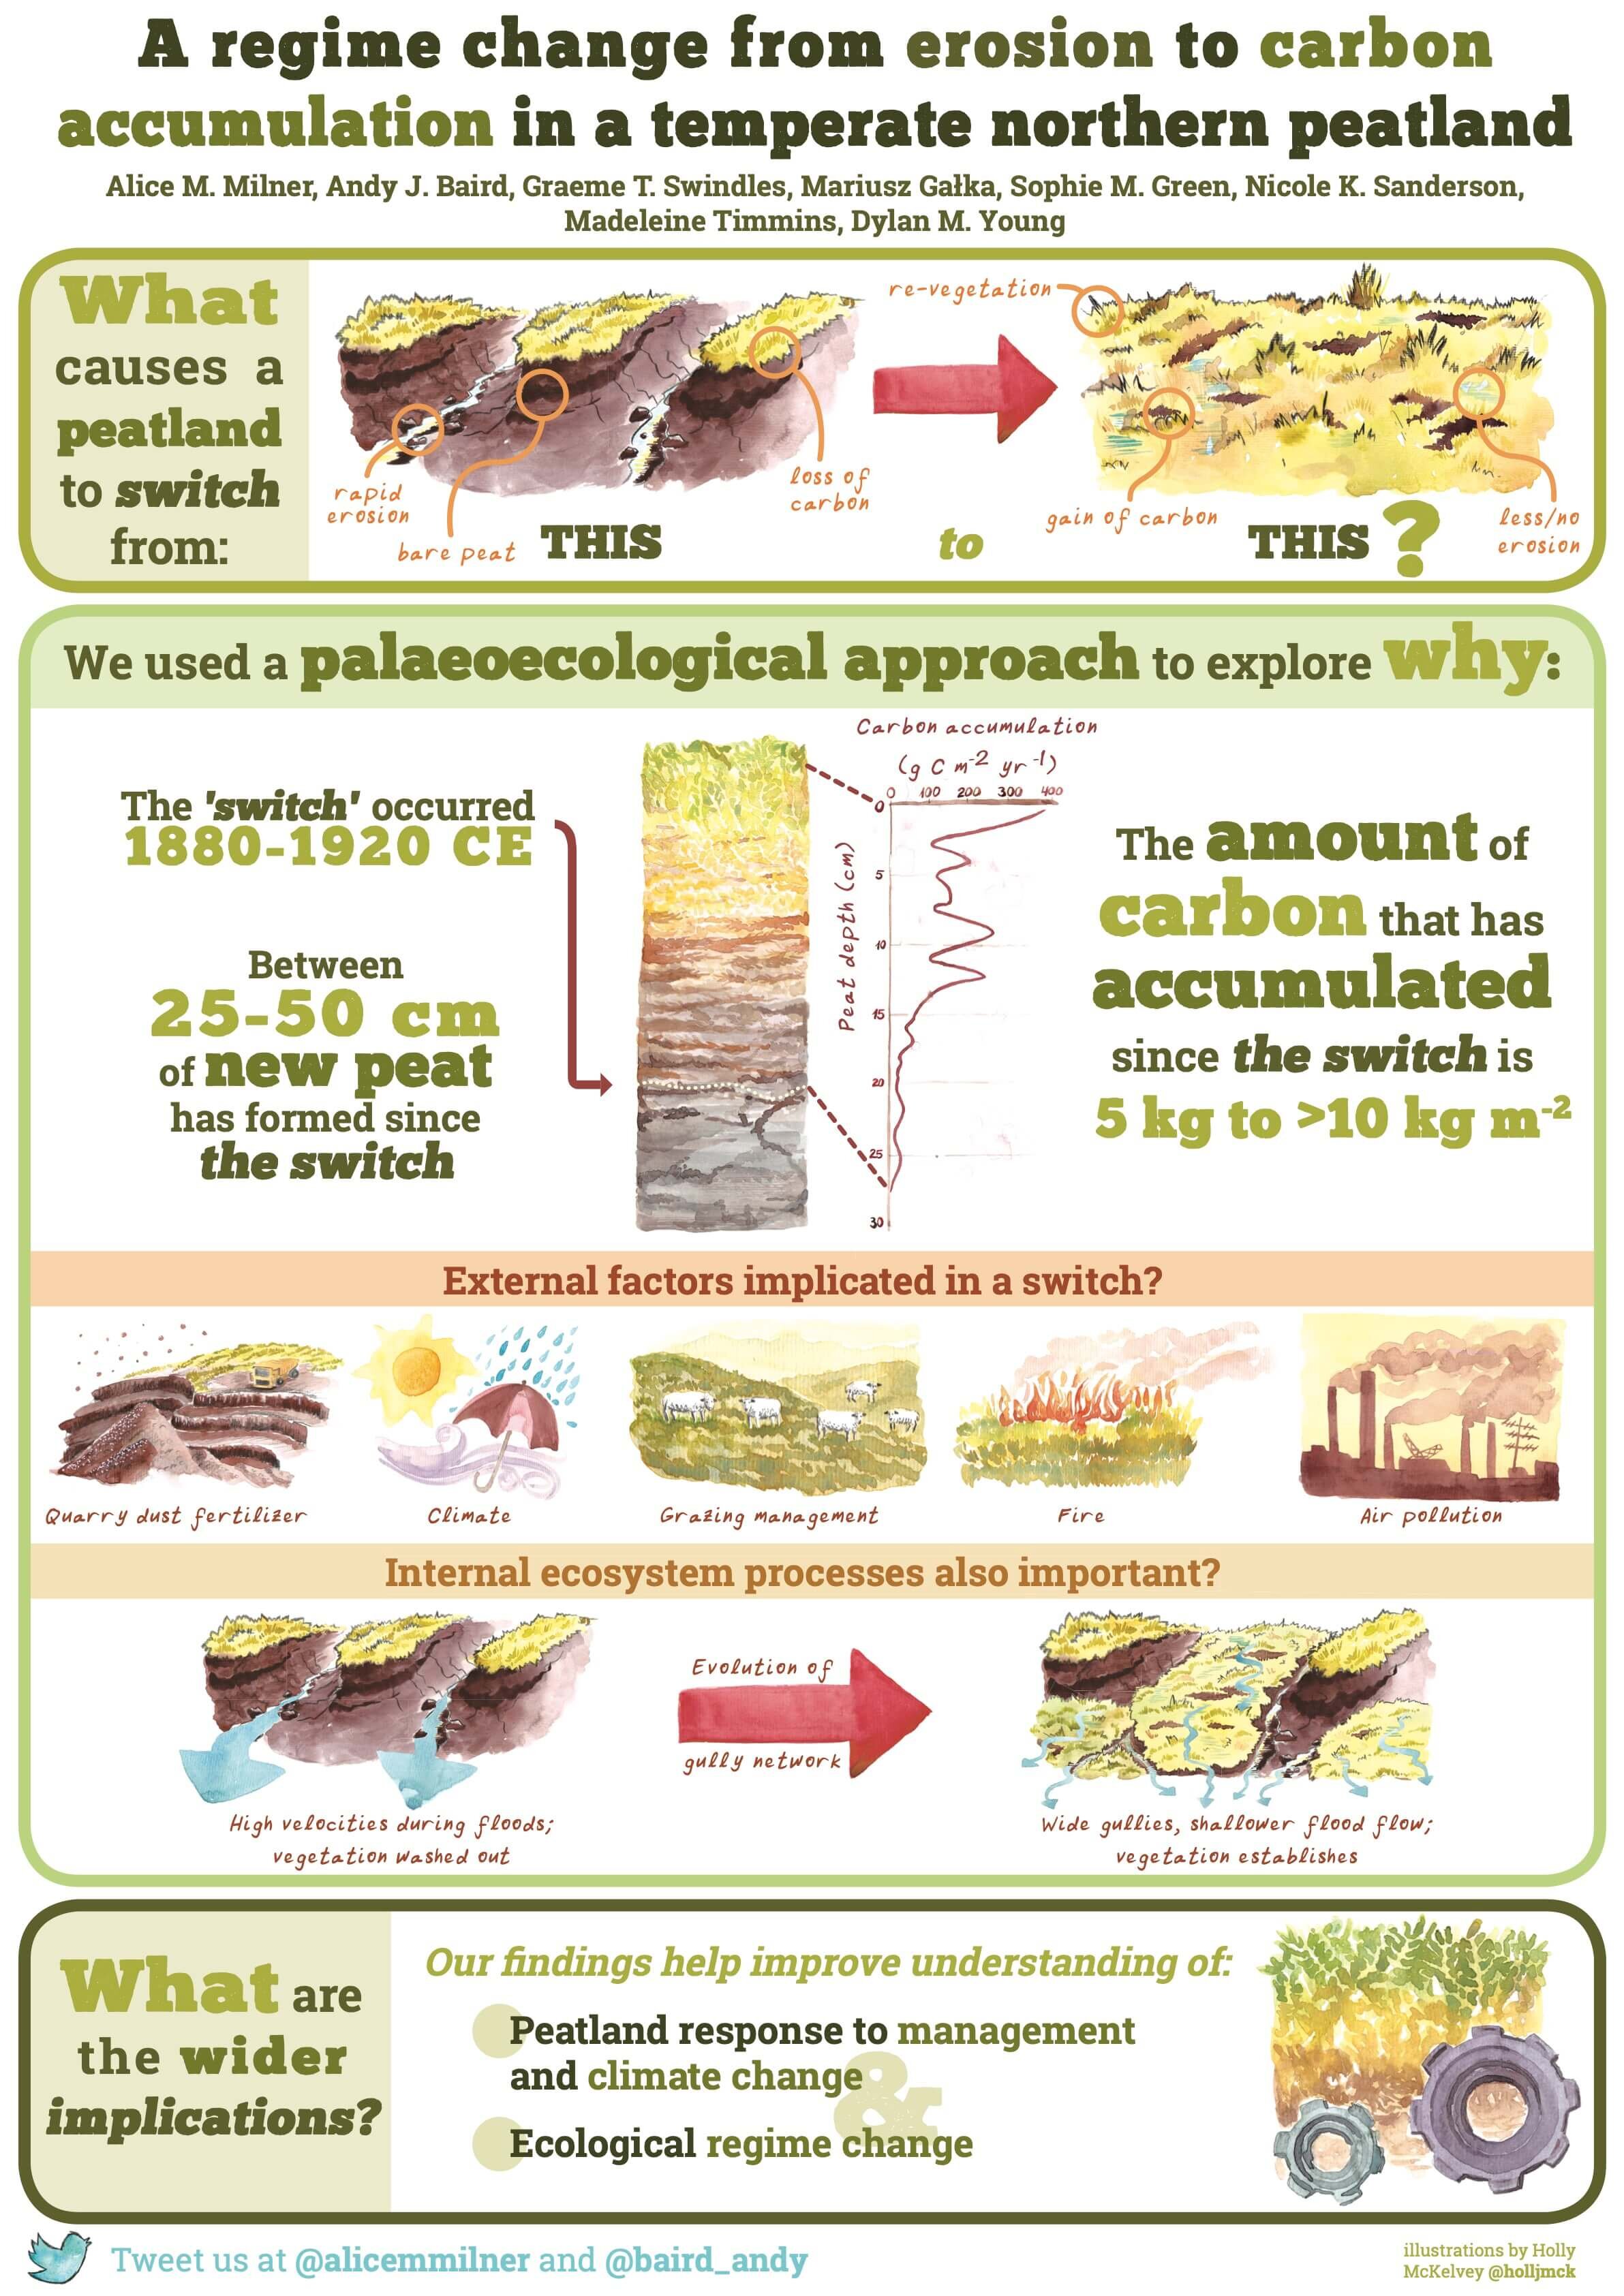
Peatlands Poster
I had the opportunity to do the artwork for this poster on carbon accumulation in peatlands for Alice Milner and Andy Baird for the #INQUADUB19 conference. You can find their paper here.
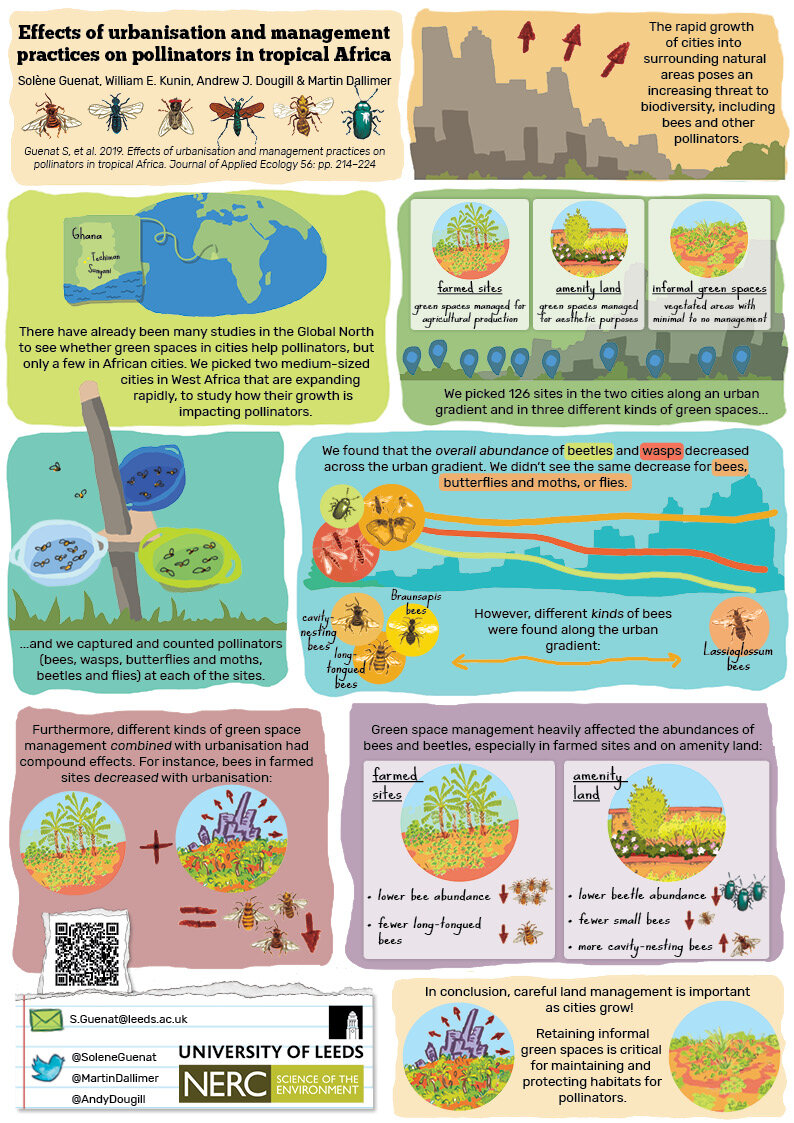
Scicommic: Impacts of urbanisation on pollinators
A scicommic I did for Solène Guenat exploring her research on the impacts of urbanisation and greenspace management in two cities in Ghana. You can find the full paper here.

Infographic: Effects of climatically shifting species distributions on biocultural relationships
This infographic appeared on the People and Nature blog, Relational Thinking, to accompany a plain-language summary of an article published in People and Nature, British Ecological Society. 1(1), March 2019: pp87-102 (read the plain-language summary here).

Infographic: Mit Hunden in der Landschaft
I produced this in collaboration with the Planungsbüro Mordhorst-Bretschneider GmbH, to raise awareness about the impacts of having dogs off-leash out in nature. You can find the full infographic and pamphlet (in German) here.
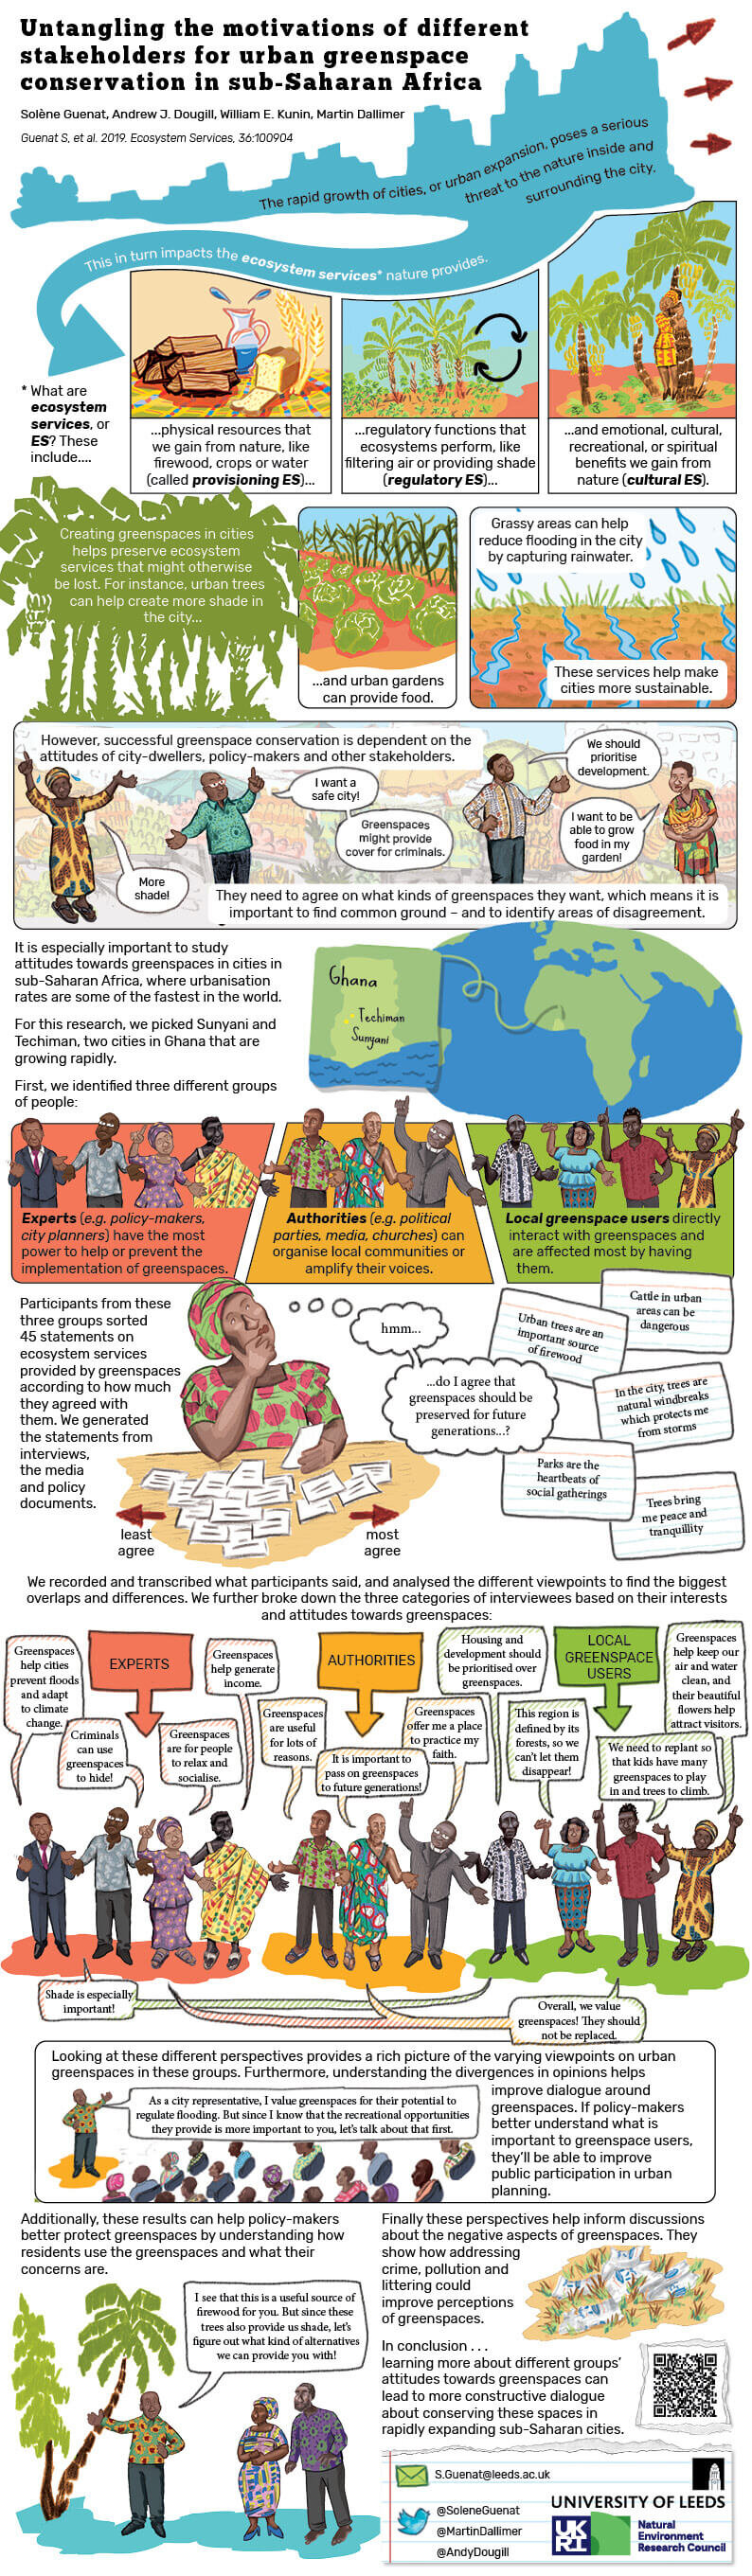
Scicommic: Untangling stakeholders’ motivations
A scicommic I did for Solène Guenat exploring her research into the relationships of various stakeholders towards greenspaces in two cities in Ghana. You can find the full paper here.

Infographic: Rethinking coral reef functional futures
This infographic for Functional Ecology was for a special feature on how coral reef functions (including the ecosystem services we derive from them) will continue to evolve in the face of further climate and technological change. Find the articles here.